If you know anything about the app industry, you know that it’s constantly changing.
That means that what is popular right now can quickly fall out of favour – looking at you, Yik Yak — tomorrow. These stats will help you understand the app industry as it is happening right now. We have gathered some killer insights about what works and what doesn’t and how to predict consumer demand to maximize the reach of your app.
From insights on food and beverage apps, to app compatibility with wearable technology, to mobile payment apps, we’ve got the facts to back your next stroke of genius app idea.
The team at MindSea has compiled this list of 27 Mobile App Stats that have had an influence on the way we think about iOS App Development, Android Design and much, much more. If you’re looking for Mobile App Stats that are redefining the way mobile products are built, you’ve come to the right place.
Let’s get to it.
Twenty percent of queries to a search engine were made by voice rather than a typed query in 2016 (Mary Meeker Report, 2017)
Voice recognition technology is more accurate, intuitive, and accessible than ever. Smartphone users are happy with this change and see voice queries to search engines as tools to save time. For example, a consumer might be driving and not want to pick up their smartphone but need to know how to get to the next gas station. They are more likely to ask their search assistant for the answer rather than pull over to type in the request.
60 percent of users who use wearable technology are willing to share their health data collected from their devices to Google in 2016 (Mary Meeker Report, 2017)
Wearable technology like FitBits and other exercise trackers gathers information about your activity levels, sleep, location, and general health. Many users connect their data to Google services because it helps integrate the information between health apps. This shows a great level of trust that consumers have for both their wearable products and their smartphone technology.
Mobile advertising has increased 22 percent in 2016 (Mary Meeker Report, 2017)
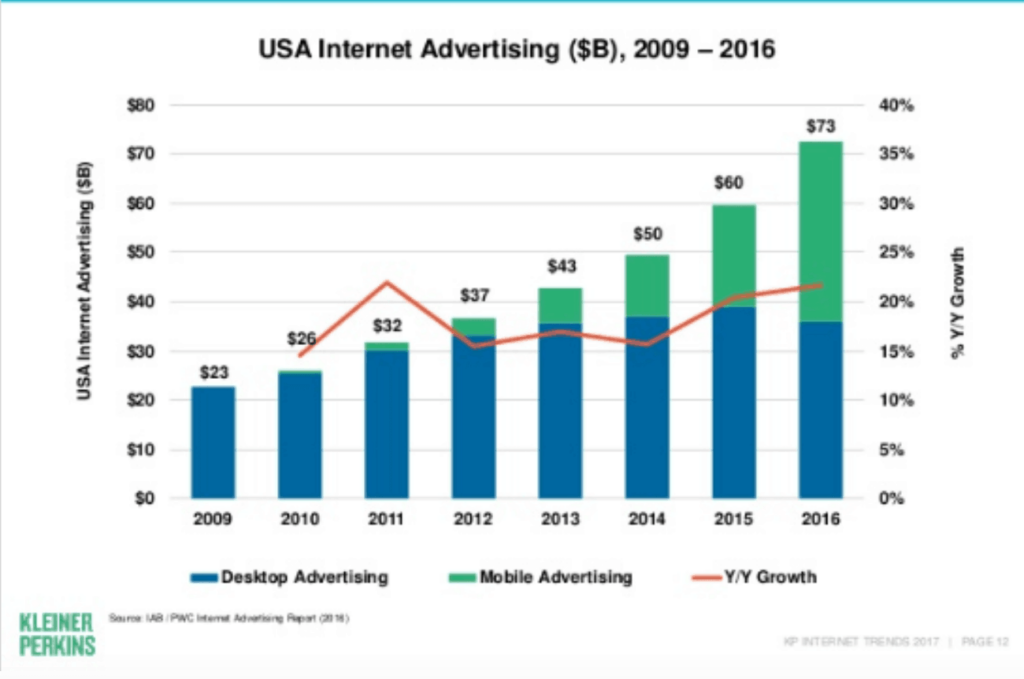
People are using their smartphones more than ever and the digital marketing industry is beginning to catch on to the most effective ways of reaching mobile users with digital advertising. Apps which have seamless advertisements to limit distraction from user experience but still deliver a strong message are the most effective.
Consumer smartphone purchases are slowing down, having grown 10 percent in 2015 and only 3 percent in 2016
It seems that we are reaching the saturation point of accessibility to mobile devices. Almost everybody who “needs or wants a smartphone” now has one and this means that the global demand is slowing down as people only upgrade when they need or want a new device.
Music streaming platforms like Spotify and Apple Music are now making more money than physical music sales, giving recorded music its first revenue growth in 16 years (Mary Meeker Report, 2017)
Smartphones are well suited for music streaming platforms because unlike iPods, consumers love being able to access almost any song and download the albums they want now for offline use. It gives much more choice than buying one album at a time. Advertisements geared toward these platforms perform well because there is a desire to hear the rest of an album or song. It is difficult to ignore the advertisement.
It is estimated that in the US people spend an average of 3 hours on their mobile devices while desktop usage hasn’t declined (Mary Meeker Report, 2017)
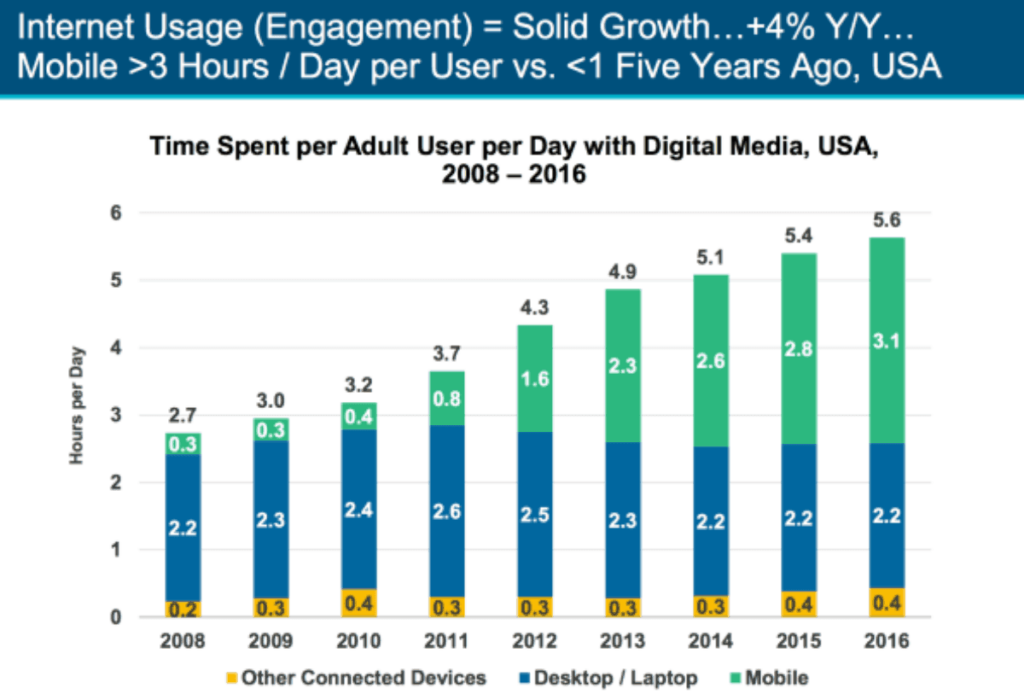 People are more frequently and consistently plugged in then ever. This stat is notable because desktop usage has remained the same. Time spent online is at an all time high. Knowing this information, markets should understand that mobile advertising is a huge market with room for growth.
Internet users in Indonesia spend 90 percent of their time online on a mobile device. (Smart Insights, 2017)
Understanding how people across the globe interact with their mobile devices will help you reach people in the places where they spend most time interacting and connected. It is important to understand which demographics spend the most time on their phones and which spend more time on their desktops to tailor advertising for this.
Most people use their phones to access their internet in the morning, desktop computers during work hours, and tablets in the evening (Smart Insights, 2017)
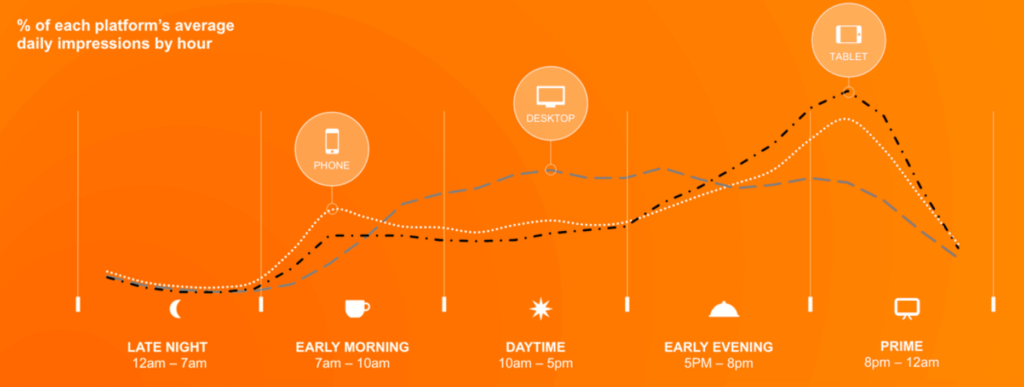
Specificity rules in marketing. If you can show a consumer an advertisement that makes sense with where they are at in their day, it is much more likely that they will pay attention to your message. This means not only optimizing your reach for device, but what time of day that your audience uses that device.
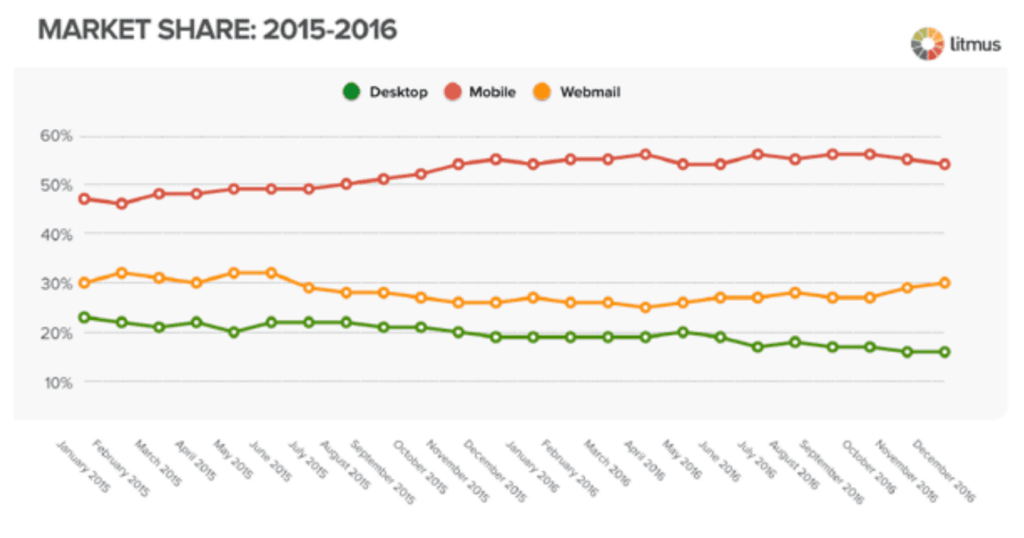
Over half (54 percent) of emails are opened on mobile devices. (Litmus, 2017)
Work doesn’t just get done exclusively at the office anymore. More people are reading email as it comes in on their phones instead of waiting until they are back at their desk to read and reply. It’s important to think about how your message and design come across on a mobile platform.
Replies sent from mobile devices are received 54 percent faster than replies sent from desktops. (Yahoo, 2015)
While desktops are still the preferred platform for crafting long email replies, mobile replies are becoming more popular. Thankfully, this simplifies much of the formalities typically associated with email. Short one line emails are becoming the norm and we’re grateful for that.
The median reply time for a mobile response is 28 minutes while emails sent from desktops are typically answered within 62 minutes. (Yahoo, 2015)
It is simple and convenient to open an email on your desktop and assign it to a tab with a plan to return to it later. Mobile users tend to reply faster with emails that are more concise. This helps people be more productive and encourages efficient communication.
Mobile phone users spend 90 percent of their media time on applications while the other 10 percent is spent on websites accessed through a browser (Smart Insights, 2017)
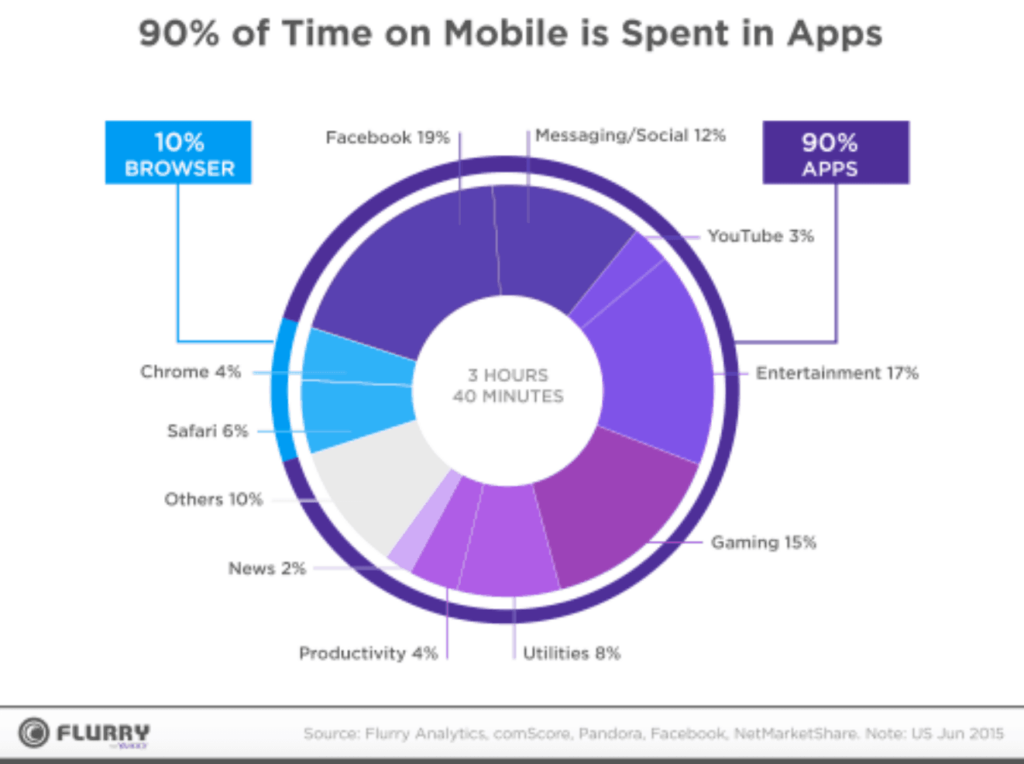
Smartphones are app dependent. Consumers love apps, especially those which have a clear purpose and clean design.
Most online searches made from a mobile device were to access information about the food and beverage industry (Smart Insights, 2017)
Apps like Uber Eats, Opentable, TripAdvisor, and Yelp dominate the restaurant industry. Mobile applications have completely changed how the food and beverage industry operates, especially when it comes to consumer research and bookings.
According to Google, 90 percent of millennials go online daily (Google, 2017)
Google’s report makes it clear that the distinction between “real” life and life lived online has become muddied, and that “real life happens online” because “offline and online worlds are intertwined” (2017). Apps such as Tinder, Snapchat, Instagram, and Facebook give opportunity for real connections and friendships to be made and developed. The apps which are most successful with the millennial demographic are ones which incite desire for the consumer to return day after day to ensure they are not missing out on social experiences.
The same study from Google’s Consumer Barometer finds that 75 percent of millennials use their smartphone to go online at least as often as their computer (Google, 2017)

Earlier we discovered that 90 percent of time spent on mobile devices is spent using apps. This means that those who use their smartphone to access online information depend on reliable and functional applications designed for the best mobile experience.
Pinterest is the mobile social network most favoured by smartphone users, generating 64 percent of its referred traffic from either phones or tablets (Mobile Marketing Watch, 2014)
Pinterest has made mobile user experience a priority and does not limit what users cannot do on mobile which they do on desktop versions of the website. The platform’s main concept of surfing for inspiration works well for mobile users who are used to flipping through magazines while waiting for appointments or on the bus.
It is estimated that 72 percent of all US digital ad spending will be used on mobile specific advertisement (Marketing Land, 2015)
These dollars are best spent investing in apps which do not rely solely on advertisements to make their profits. Users prefer an experience in which advertising is relatively seamless, such as Instagram or Twitter who show advertisements as pictures and tweets which have been curated for you.
180 percent more emails are opened on mobile devices in the last three years (Email Monday, 2017)
It is important to always optimize email campaigns for mobile users. If you are having issues with your open rates, it is likely a problem with the delivery and wording of your email rather than the mobile app your audience is using, or waiting until they are at a desktop to open your email.
There are now more people (79 percent) who use their smartphone for reading emails than those who use it for making phone calls (Email Monday, 2017).
Consumers rely on email app such as Gmail or Apple Mail as much or more as their Phone applications. While it is unlikely that a new app will replace either of these preferred apps, developers can prioritize quality email integration.
Almost half of millennials (48 percent) watch video content exclusively on their mobile device (Business of Apps, 2016)
This video content is being watch on apps such as Youtube, Facebook, Twitter, Instagram, Snapchat, Netflix, and many other platforms. Videos embedded in a web page will often prompt the browser to open the app best suited to play the video.
Millennials decide to use an app based on its functionality (48 percent), social influence from peers (45 percent), and the aesthetic appeal (37 percent) of its design (Mindsea, 2017).
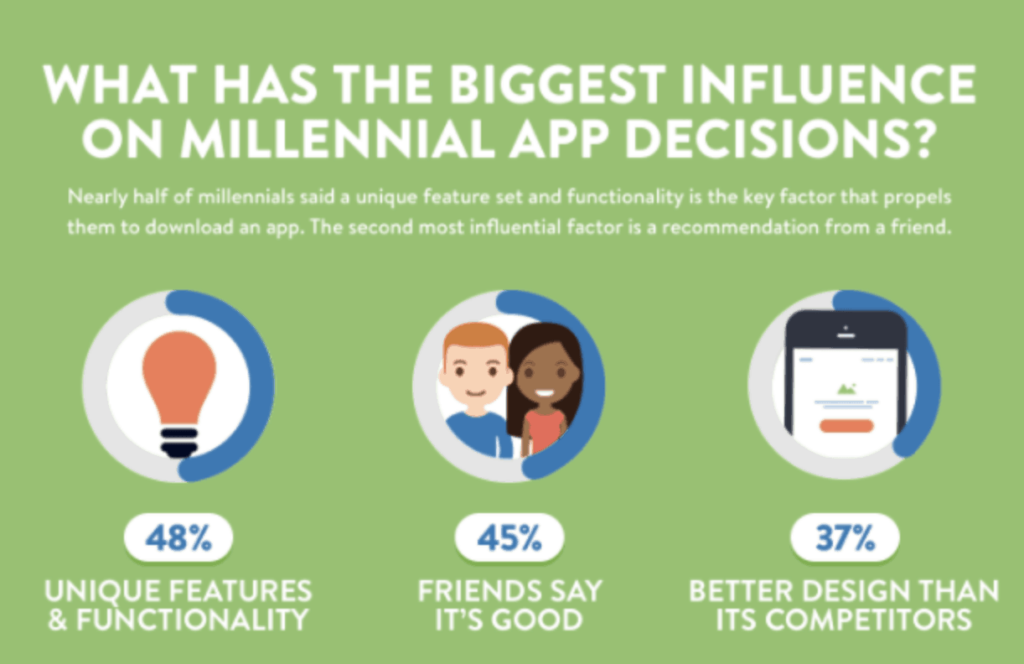
These three features of an app are key when designing apps with millennials in mind. This demographic of consumers are influenced by the practicality and functionality of an app, always asking these questions: What can it do, and how can it help me save time or improve my life? Are my friends using it? If so, I don’t want to be left out and want to see what the hype is about. Does it have fresh, modern design?
40 percent of smartphone user search queries seek local information (Google, 2013)
It is important for all business, even small mom and pop shops, to have a mobile marketing strategy on apps such as Yelp, Trip Advisor, Facebook, and Google products to make sure their business is best optimized for local people to find it.
49 percent of millennials consider an app with high battery usage to be a dealbreaker (Mindsea, 2017)
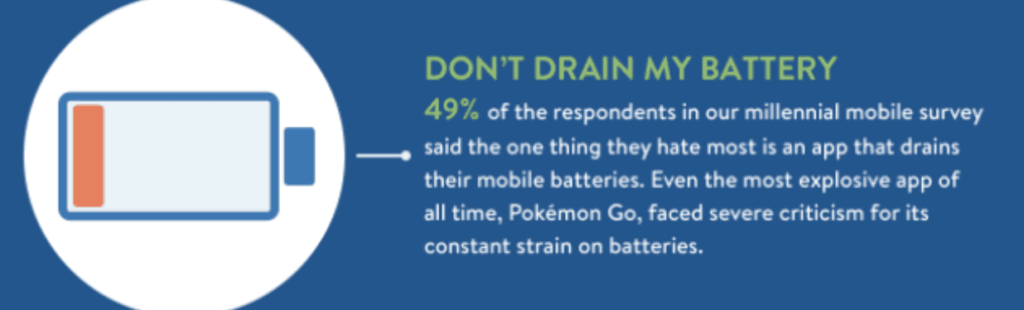
Even the best smartphones have issues holding a charge. While many people carry around portable chargers, it isn’t always an option, and when considering what apps to use on the go, millennials will always consider which uses the most battery.
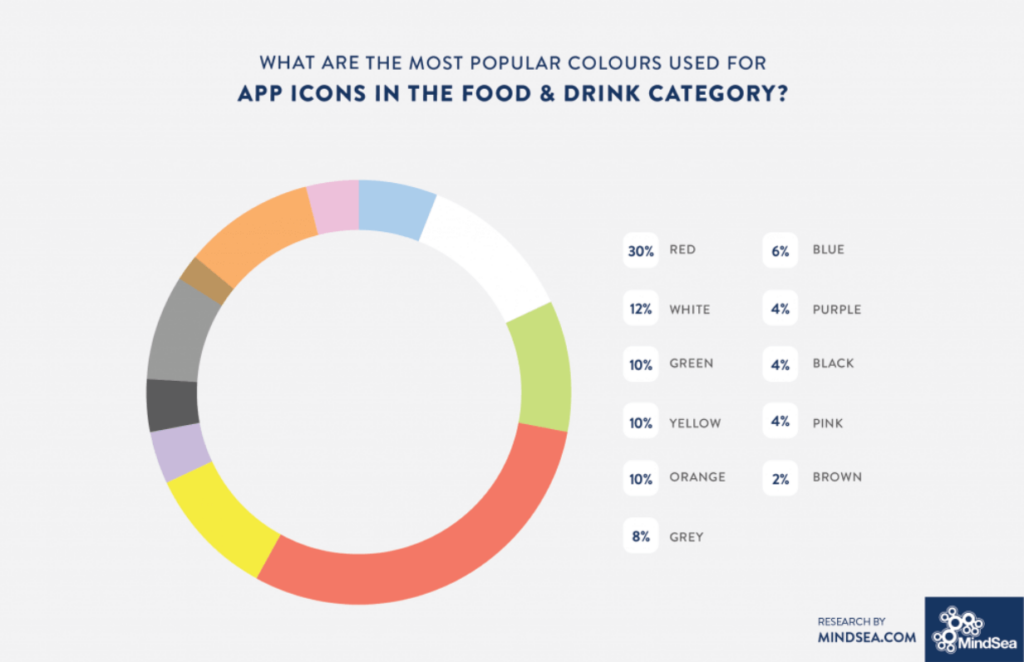
Even though blue is overwhelmingly the most popular icon colour for apps (24 percent of all apps), 30 percent of all food and drink apps are red while only 6 percent are blue (Mindsea, 2017)
Colour theorists suggest that the colour red encourages feelings of strength, energy, and action, and is even said to stimulate the appetite. This sets food apps apart from the sea of blue apps on your phone, and because food apps are more purchase driven than most, it will make them stand apart and draws the eye to the red colour.
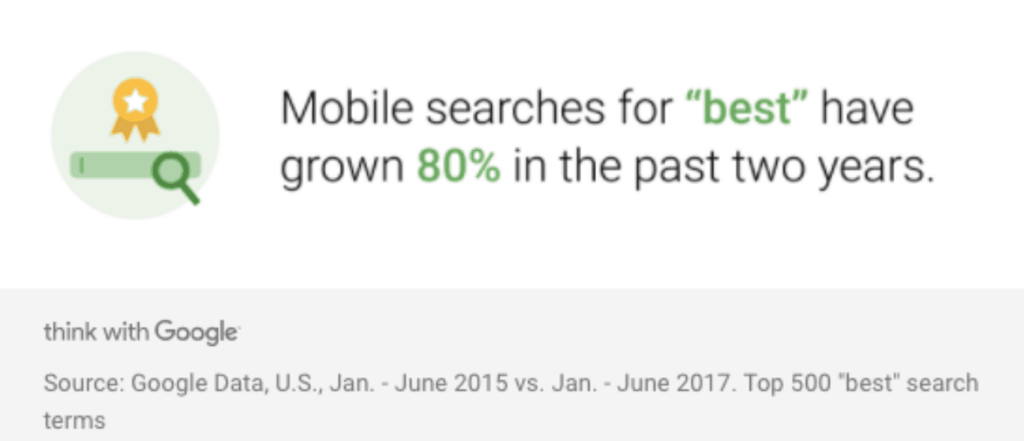
Mobile searches using the word “best” (ex. best laundry detergent) have increased by 80 percent in the past two years (Think With Google, 2017)
People turn to phones for advice. People carry their mobile devices with them in their most intimate moments and it is a constant companion to help them make decisions. These decisions can be mundane, such as what laundry detergent to buy or where to eat lunch, but can also be important such as planning a wedding or once in a lifetime European backpacking adventure. They want to trust that the applications they use to find this information will show them the “best” advice.
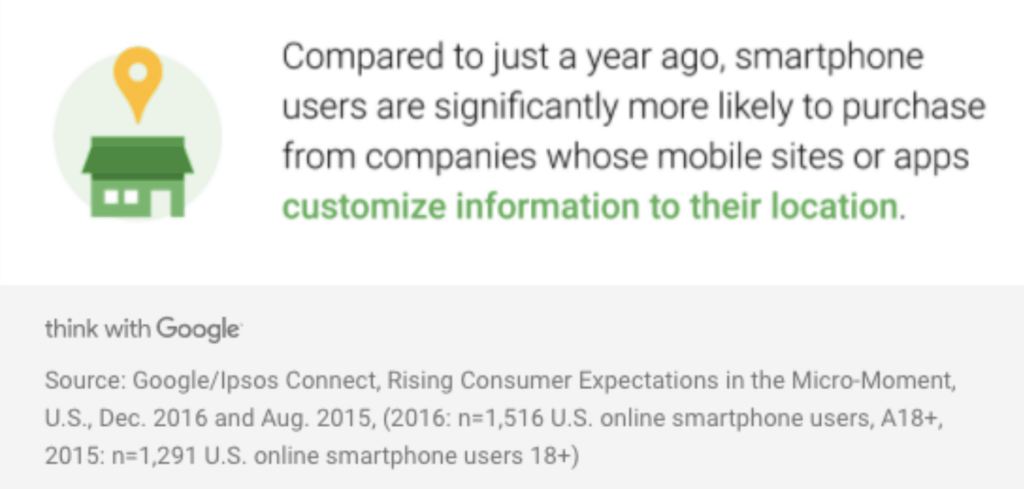
Smartphone users are more likely to purchase from companies who tailor information about their search queries to their location without asking (Think With Google, 2017)
For example, users are less likely to type “sushi near me” or “sushi Toronto” than they were even a year ago. More people expect that their results for typing “sushi” will bring local results first, trusting that their mobile search engine is able to contextualize information already being gathered about them. This shows an intelligence and foresight which consumers like, and makes them more likely to convert from search query to purchase.
Compared to 2016, smartphone users are now 50 percent more likely to use their device to make a spur of the moment purchase (Think With Google, 2017)
Compared to 2016, smartphone users are now 50 percent more likely to use their device to make a spur of the moment purchase (Think With Google, 2017)
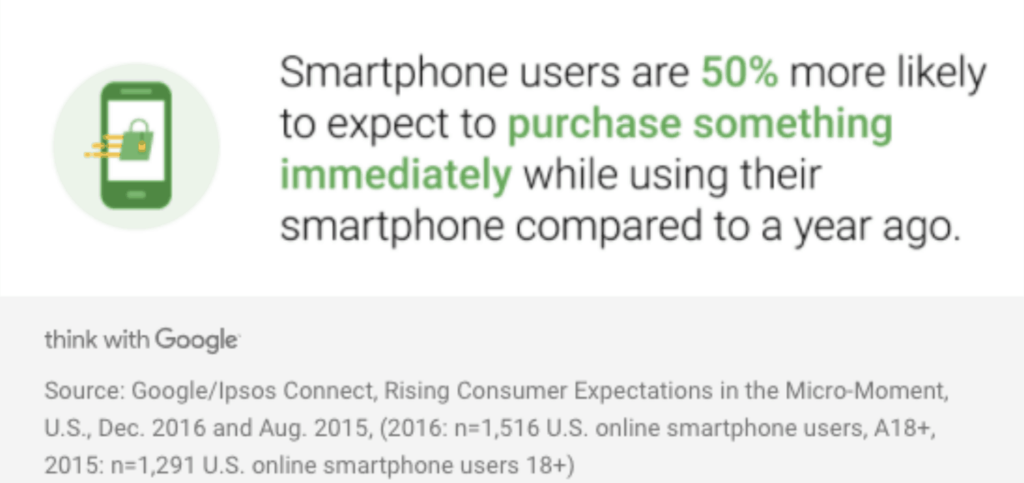
These figures show that consumers are more trusting than ever with smartphone technology and are willing to make spur of the moment purchase decisions on their device instead of waiting until they are at their desktop. This could be attributed to better UX and more integration with banks who have partnered with smartphones to create app based mobile pay experiences.
Wrapping Things Up
We’re sure that these stats will help you build and grow your next app project or even spark an idea for a new project. If you’re interested in learning more about mobile app development, check out some of our other resources:
- The One Thing Every App Should Have Before Going Live In The App Store
- How To Know When You’re Ready To Launch A Mobile App
- 7 Startups That Won At Creating Apps For Millennials
If you want to chat further with our team about your app idea, get in touch! We would love to hear about it.